Plotting
ezGPX currently provides many different ways to plot a GPX object.
Warning
These features are likely to be deprecated and removed in future versions.
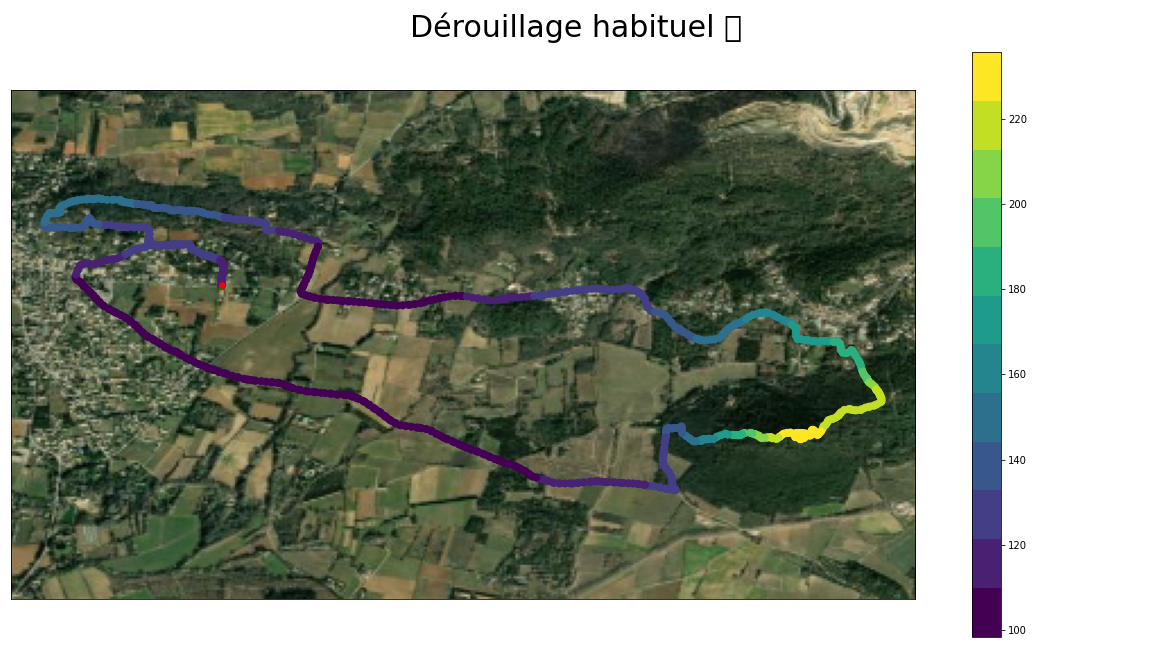
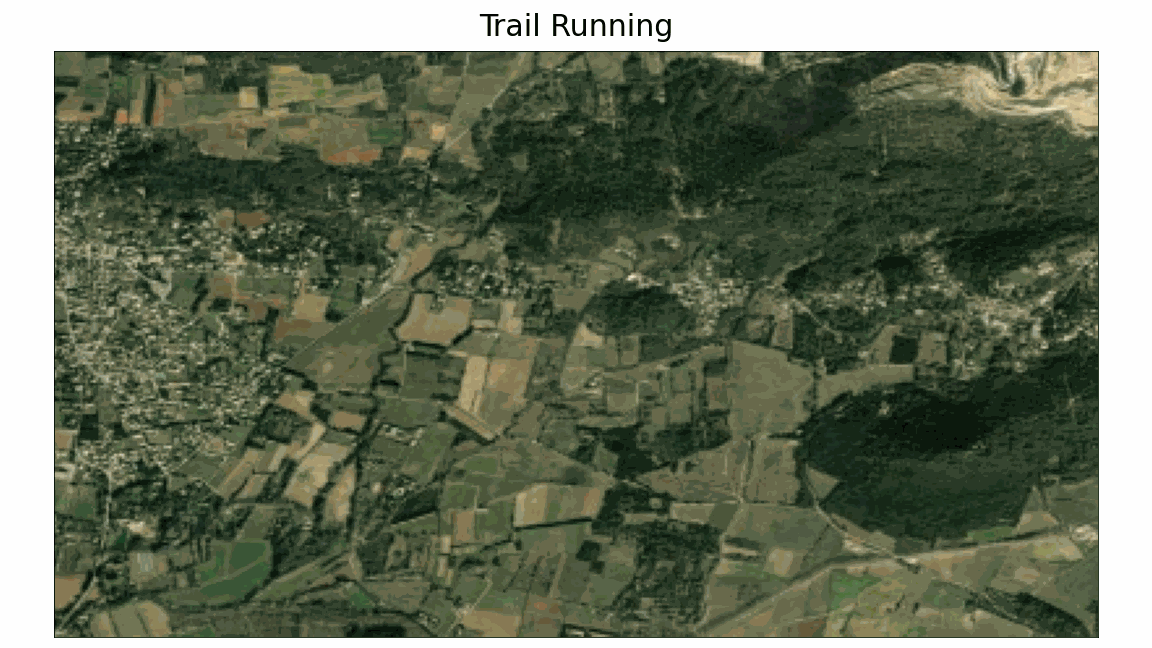
Matplotlib
Relying on the well known Matplotlib library, you can create static or animated plots of GPX files.
Warning
Requires basemap.
import ezgpx
import matplotlib as mpl

# Parse GPX file
gpx = ezgpx.GPX("file.gpx")

# Plot with Matplotlib
plotter = ezgpx.MatplotlibPlotter(gpx)
plotter.plot(
    figsize=(16, 9),
    size=50,
    color="ele",
    cmap=mpl.cm.get_cmap("viridis", 12),
    colorbar=True,
    start_point_color="green",
    stop_point_color="red",
    waypoints_color="blue",
    background="World_Imagery",
    title=gpx.name(),
    title_fontsize=30,
    file_path="matplotlib.png"
)

# Animated plot with Matplotlib
plotter = ezgpx.MatplotlibAnimPlotter(gpx)
plotter.plot(
    figsize=(16, 9),
    size=10,
    color="#FFA800",
    background="World_Imagery",
    dpi=50,
    fps=34,
    repeat=True,
    title="Trail Running",
    title_fontsize=30,
    file_path="matplotlib.gif",
)
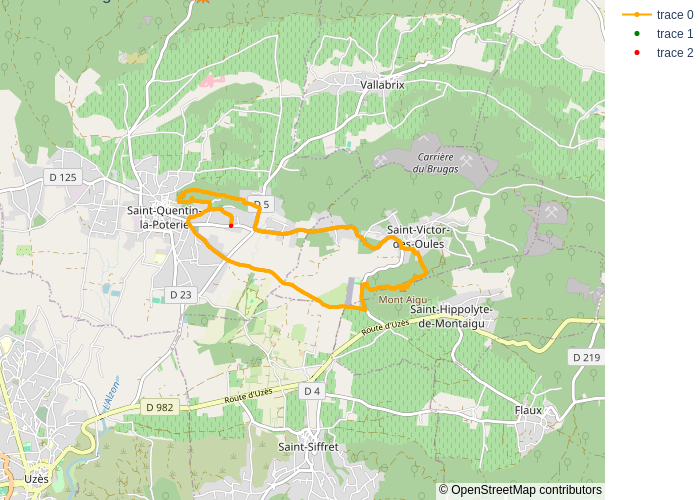
Plotly
Relying on the well known Plotly library, you can create static, interactive or animated plots of GPX files.
Warning
Requires basemap.
import ezgpx

# Parse GPX file
gpx = ezgpx.GPX("file.gpx")

# Plot with Plotly
plotter = ezgpx.PlotlyPlotter(gpx)
plotter.plot(
    tiles="open-street-map",
    mode="lines+markers",
    color="#FFA800",
    start_stop_colors=("green", "red"),
    waypoints_color="blue",
    title=gpx.name(),
    zoom=12,
    file_path="plotly.png",
)

# Animated plot with Plotly
plotter = ezgpx.PlotlyAnimPlotter(gpx)
plotter.plot(
    tiles="open-street-map",
    color="#FFA800",
    title=gpx.name(),
    zoom=12,
    file_path="plotly.gif",
)
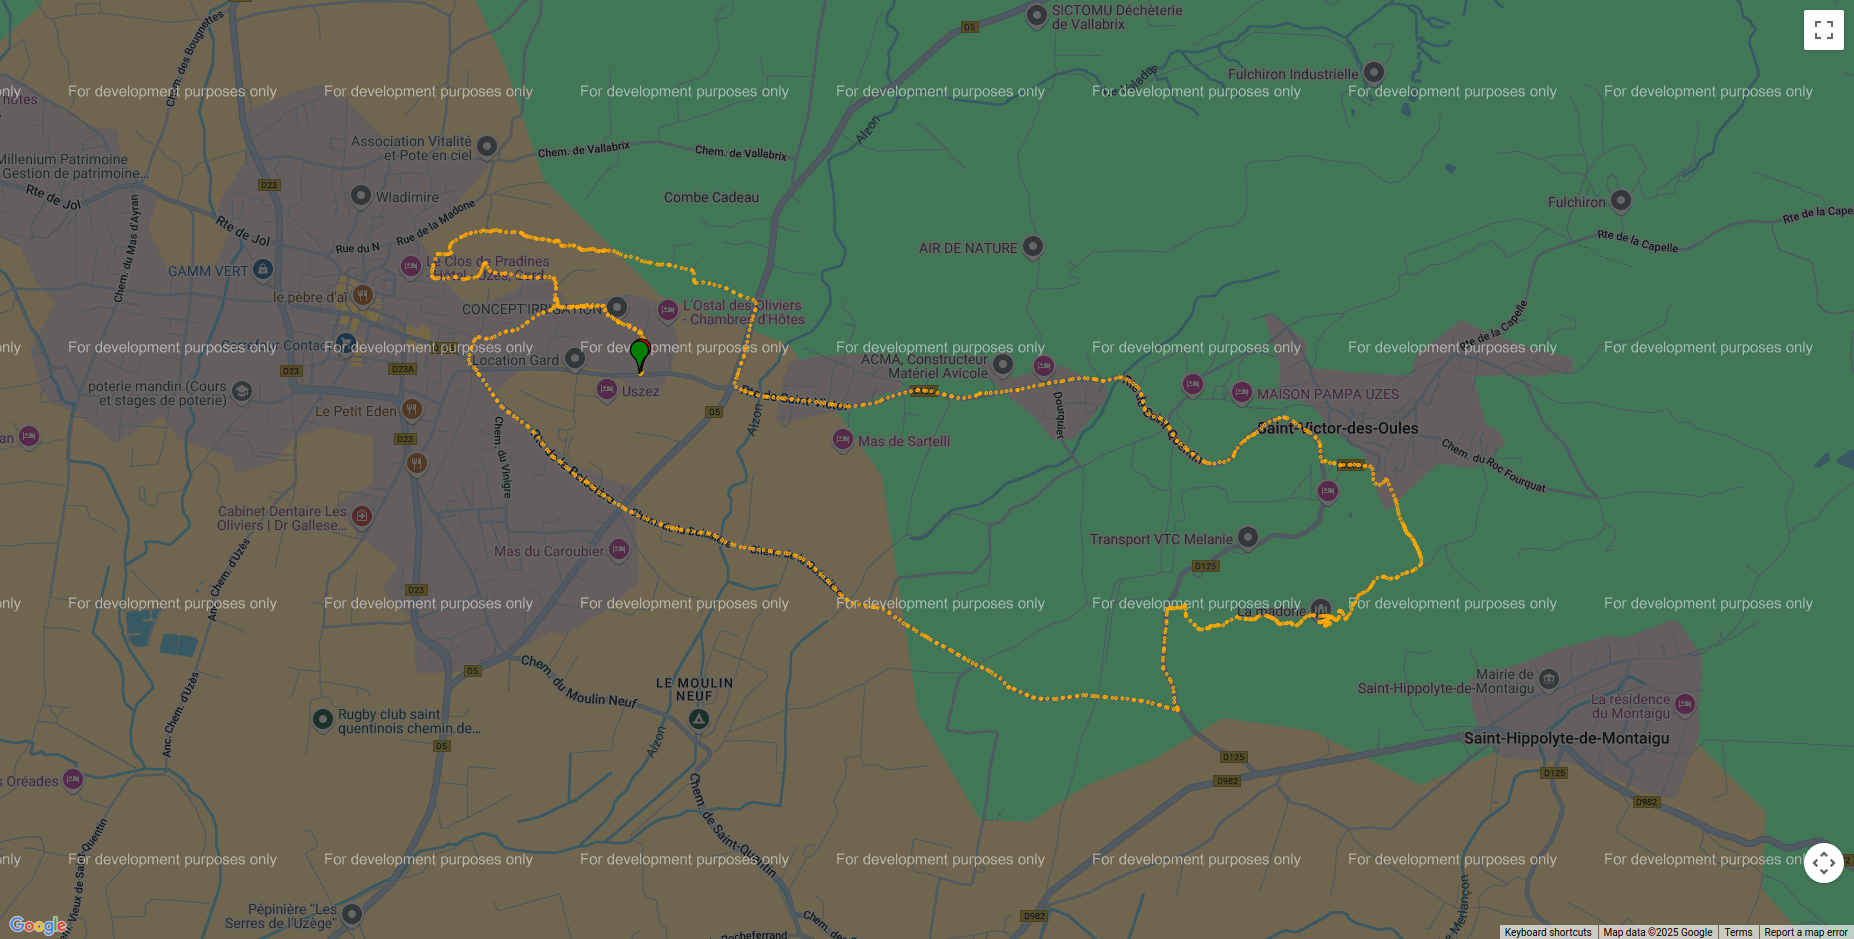
gmplot
This method uses the Google map engine to display the content of the GPX file in a HTML page.
Warning
Requires gmplot.
import ezgpx

# Parse GPX file
gpx = ezgpx.GPX("file.gpx")

# Plot with gmplot (Google Maps)
plotter = ezgpx.GmapPlotter(gpx)
plotter.plot(
    color="#FFA800",
    start_stop_colors=("green", "red"),
    waypoints_color="blue",
    scatter=True,
    plot=False,
    zoom=15,
    file_path="gmplot.html",
    browser=True,
)
Folium
The interactive HTML page resulting from this method allows you to visualize the content of a GPX on a nice looking map.
Warning
Requires folium.
import ezgpx

# Parse GPX file
gpx = ezgpx.GPX("file.gpx")

# Plot with Folium
plotter = ezgpx.FoliumPlotter(gpx)
plotter.plot(
    tiles="OpenStreetMap",
    color="#FFA800",
    start_stop_colors=("green", "red"),
    waypoints_color="blue",
    minimap=True,
    coord_popup=True,
    zoom=15,
    file_path="folium.html",
    browser=True,
)

Map Plotting
Contextily
Warning
Requires contextily.
For more information consults contextily documentation.
import ezgpx
import contextily as cx
import matplotlib.pyplot as plt

# Parse GPX file
gpx = ezgpx.GPX("file.gpx")

# Plot map with Contextily
min_lat, min_lon, max_lat, max_lon = gpx.bounds()
im, bbox = cx.bounds2img(
    min_lon,
    min_lat,
    max_lon,
    max_lat,
    ll=True,
    source=cx.providers.OpenStreetMap.Mapnik,
)
plt.imshow(im)
plt.savefig("contextily.png")
Papermap
Warning
Requires papermap.
For more information consults papermap documentation.
import ezgpx
from papermap import PaperMap

# Parse map GPX file
gpx = ezgpx.GPX("file.gpx")

# Plot map with Papermap
center_lat, center_lon = gpx.center()
pm = PaperMap(
    lat=center_lat,
    lon=center_lon,
    size="a4",
    use_landscape=True,
    scale=50_000,
    add_grid=True,
)
pm.render()
pm.save("papermap.pdf")
Prettymaps
Warning
Requires prettymaps.
For more information consults prettymaps documentation.
import ezgpx
import prettymaps

# Parse map GPX file
gpx = ezgpx.GPX("file.gpx")

# Plot with Papermap
center = gpx.center()
plot = prettymaps.plot(center)